 PCOS Weight Loss
What Is Ultra-Processed Food? A Meal Score Guide
Ultra-processed food is the processing category the meal score's quality part weighs least, and this article shows the arithmetic behind that with a worked example.
Published
Quick answer
What is ultra-processed food? In the meal score it's the category that counts least in the quality part — weighted 0.15 by calories, versus 1.0 for minimally processed and 0.6 for processed food, lowering that fifth of the 0–10 score.
Key takeaways
- Ultra-processed food counts 0.15 by calories in the quality part of the meal score, versus 1.0 for minimally processed food.
- Quality is 20% of the 0–10 score, worth up to 2 points before protein, fiber and sugar are counted.
- Protein, fiber and added sugar score the same way no matter how processed a food is.
- The food scanner estimates processing category from a photo, the same way it estimates protein and fiber.
- None of the three processing categories is a verdict — each is one input among four.
Ultra-processed food is the processing category that counts the least in the quality part of the meal score — by calories it's weighted at 0.15, next to 1.0 for minimally processed food and 0.6 for processed food.
You don't have to sort a plate into these categories by hand. The food scanner estimates processing category from a photo the same way it estimates protein, fiber and added sugar, then the four parts combine into the 0–10 number explained on the how the score works page.
What is ultra-processed food, in the meal score's terms?
In the score, minimally processed food is close to its whole form — plain vegetables, plain yogurt, oats, a cut of chicken. Processed food has had something added or taken away, like canned beans in brine or sliced deli turkey. Ultra-processed food is built mostly from ingredients that don't show up in a home kitchen — extracted starches, isolated proteins, added colors and flavoring.
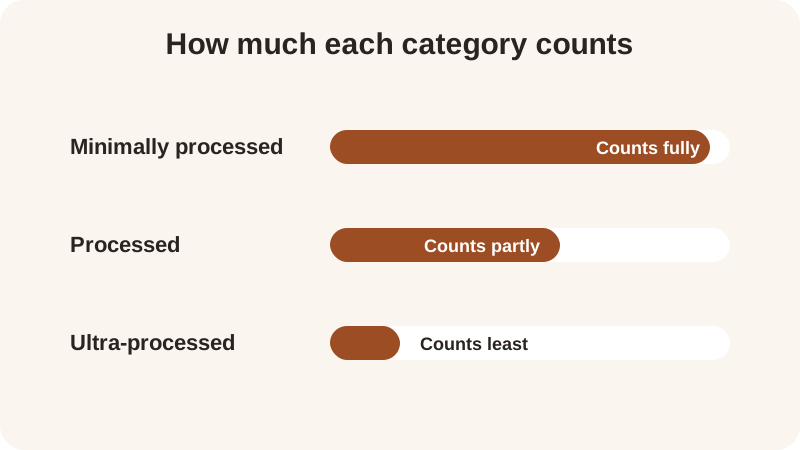
Everyday examples that tend to land in each category:
- Minimally processed: plain Greek yogurt, lentils, frozen broccoli, eggs, oats
- Processed: canned beans, deli turkey, canned tomatoes, block cheese
- Ultra-processed: flavored instant noodles, packaged pastries, flavored chips, sugary cereal, soda
This part of the score exists because how a food was made is a different question from how much protein or fiber it carries per calorie. A packaged protein bar can be fairly protein-dense and still mostly ultra-processed, and the score keeps that distinction visible instead of folding it into one number.
None of the three categories is a verdict on a food or on the person eating it. They're one input into one-fifth of the meal score, the same way grams of protein feed into another fifth.
How much does ultra-processed food affect the meal score?
Quality is 20% of the 0–10 meal score, so that part is worth up to 2 points out of 10. A meal that's entirely minimally processed calories keeps the full 2 points from this part. A meal that's entirely ultra-processed calories keeps about 0.3 of those 2 points, because the 0.15 multiplier applies across that part's whole weight.
Put together, the four parts carry different weights: protein is 30%, fiber is 30%, added sugar is 20% and quality is 20%. So a meal built mostly from ultra-processed calories can still score respectably if its protein and fiber per 100 kcal are high and its added sugar is low — the quality part only ever moves one-fifth of the total.
The other three parts don't change with processing category. Protein per 100 kcal is compared with a reference of 7 g, fiber per 100 kcal with a reference of 2 g, and added sugar with a flat reference of 12 g, where lower added sugar scores higher. These are general references the score uses, not clinical targets, and all four parts combine unrounded before the final number is rounded for display.
The app is free to start and needs no account, so trying a few photos of your own meals — some leaning minimally processed, some leaning ultra-processed — costs nothing before you decide how much the quality part matters to the way you track.
What does a worked example look like?
Take an instant noodle cup with about 6 g of protein, about 1 g of fiber and about 380 kcal, most of those calories ultra-processed. That works out to about 1.6 g of protein and about 0.3 g of fiber per 100 kcal — both well under the score's references — alongside a quality multiplier near 0.15.
Compare that with Turkey Chili, one of the site's twelve recipes: about 36 g protein and 13 g fiber for 480 kcal, which works out to about 7.5 g protein and 2.7 g fiber per 100 kcal, above both references, with most of its calories minimally processed. Its listed meal score is 9.3.
| Meal | Protein per 100 kcal (about) | Fiber per 100 kcal (about) | Mostly |
|---|---|---|---|
| Instant noodle cup | 1.6 g | 0.3 g | Ultra-processed |
| Turkey Chili | 7.5 g | 2.7 g | Minimally processed |
Nutrition figures estimated from a meal photo are estimates either way, whichever category the food falls into.
Swapping half the noodle cup for a side of Edamame with Sea Salt doesn't change the noodles' own processing category, but it adds calories that are minimally processed, which lifts the meal's overall quality part — the score looks at calories across everything on the plate, not just one item. Try your own plate in the meal score calculator to watch the four parts move independently.
Which site recipes score high on the quality part?
All twelve recipes on the site lean toward minimally processed ingredients, which is part of why their scores sit high before protein and fiber are even counted. Edamame with Sea Salt scores 10.0, Turkey Chili scores 9.3, and Lentil & Spinach Soup scores 9.2 — each built mostly from whole ingredients like edamame, turkey, lentils and spinach.
If you're tracking without counting calories, Gentle Mode still shows the quality part of the score even with no calories and no scale anywhere in the app. If you want calories, macros and a weight trend next to the score instead, that's what Weight Loss Mode shows.
For watching fiber specifically, meal by meal, the fiber tracker shows fiber per 100 kcal next to each score, and it's the same scanner behind it that estimates quality, protein, fiber and added sugar from a single photo. For a full day's worth of meals scored the same way, the meal plan page lays out the numbers for every meal.
Frequently asked questions
What is ultra-processed food?
In the meal score, it's the processing category built mostly from ingredients you wouldn't use in a home kitchen — extracted starches, isolated proteins, added colors and flavoring. It's weighted at 0.15 by calories in the quality part, next to 1.0 for minimally processed food and 0.6 for processed food.
Does ultra-processed food always give a low meal score?
Not necessarily. Quality is only 20% of the 0–10 score. A meal can still carry high protein and fiber per 100 kcal and low added sugar even if some of its calories are ultra-processed, which keeps the other three parts of the score up.
How does the app know if a food is ultra-processed?
The food scanner estimates processing category from a photo the same way it estimates protein, fiber and added sugar. Nutrition figures from a meal photo are estimates, and the quality part folds that estimate into one-fifth of the final score.
Does processing category change how protein or fiber is scored?
No. Protein per 100 kcal is compared with a reference of 7 g and fiber per 100 kcal with a reference of 2 g, regardless of how processed the food is. Those two parts, plus added sugar, are separate from the quality part.
Can a meal with some ultra-processed food still score well?
Yes. Because quality is one of four parts, a meal mixing some ultra-processed calories with high protein, high fiber and low added sugar can still land in the middle or higher range of the 0–10 score.
General nutrition information, not medical advice. Figures are estimates. Talk to a doctor or dietitian about your own needs.