 PCOS Weight Loss
Food Scanner App That Scores Meals: How It Works
A food scanner app that scores meals turns a plate photo into a 0-10 score from protein, fiber, added sugar and processing, while logged meals are stored on the phone and the photo itself is sent once to identify food, with no copy kept.
Published · Updated
Quick answer
A food scanner app that scores meals, like PCOS Weight Loss, turns a photo into a 0-10 score from protein, fiber, added sugar and processing. Meals you log are stored on the phone; the photo is sent once to identify the food, then no copy is kept.
Key takeaways
- A food scanner app that scores meals blends protein, fiber, added sugar and quality into one 0-10 number.
- Meals, weight, cycle days and symptoms you log are stored on the phone, with no account needed.
- A meal photo is sent to the app's server and on to OpenAI to identify the food, then no copy is kept.
- Logging a meal by hand instead of scanning sends nothing off the phone at all.
- Photo estimates can land a point or two from a label's own numbers — that's expected, not a failure.
A food scanner app that scores meals turns a photo of your plate into a 0 to 10 score built from protein, fiber, added sugar and how processed the food is. PCOS Weight Loss works this way: point the camera at a meal, and it reads back the score along with one food idea to try next.
That's different from an app that only counts calories or logs grams of carbohydrate. The score looks at four separate parts of the plate at once, so a bowl can be lower in calories and still score lower overall if it is short on protein and fiber. The food scanner page on this site walks through the camera side of that in more detail.
How does a food scanner app that scores meals actually work?
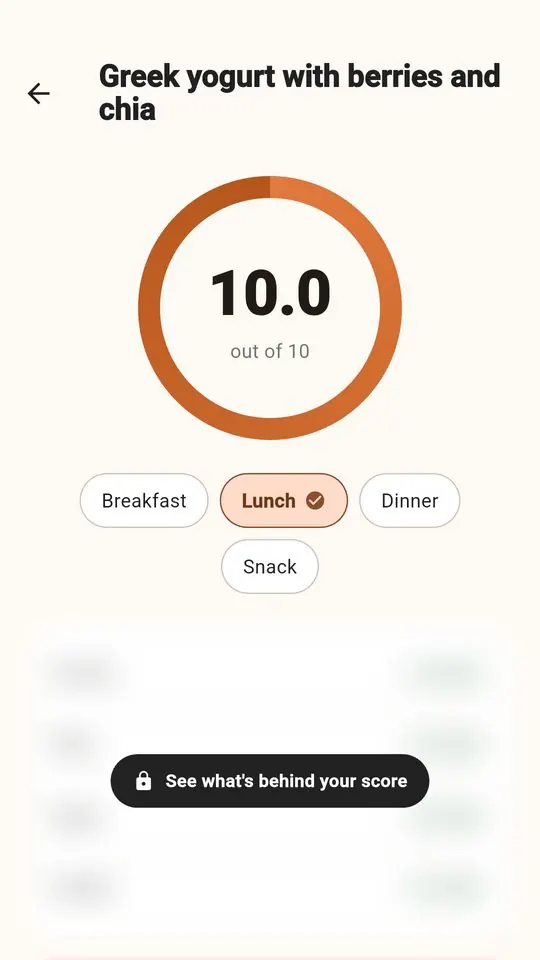
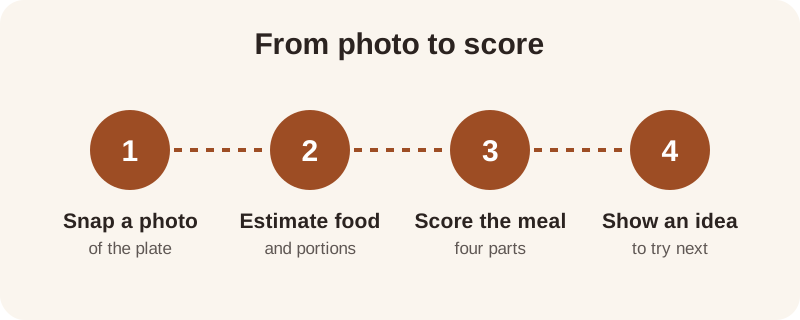
You take a photo, the app estimates the foods and portions on the plate, and it converts those estimates into grams of protein, fiber and added sugar plus a processing level, then blends the four into one number.
The nutrition figures that come out of a photo are estimates, the same way a quick visual guess at a restaurant table would be. A bowl of grilled chicken and quinoa might come back as roughly 40 g of protein and 460 kcal, close to the numbers for the grilled chicken and quinoa salad recipe on this site, which scores 9.1 out of 10.
What do the four parts of the score actually measure?
Protein and fiber are each 30% of the score, added sugar is 20% and quality — how processed the food is — is the other 20%, and the four parts are combined before the final number is rounded for display.
The protein part compares a meal with 7 g of protein per 100 kcal, and the fiber part compares it with 2 g of fiber per 100 kcal. The added-sugar part uses a flat 12 g as its reference, and lower added sugar scores higher on that part. These are general references this score uses, not clinical targets, and the full breakdown is on the how the score works page.
The quality part looks at how processed each food is, by calories: minimally processed counts 1.0, processed counts 0.6 and ultra-processed counts 0.15. A plate that's mostly grilled chicken, quinoa and broccoli reads as largely minimally processed, which lifts that part of the score toward its top end. Turkey chili with about 36 g of protein, 13 g of fiber and 480 kcal works out to about 7.5 g of protein and 2.7 g of fiber per 100 kcal — both above the score's references, which is part of why the turkey chili recipe scores 9.3 out of 10.
| Meal (recipe page) | Protein per 100 kcal (about) | Score out of 10 |
|---|---|---|
| Edamame with Sea Salt | 9 g | 10.0 |
| Lentil & Spinach Soup | 6 g | 9.2 |
| Apple with Almond Butter | 2.7 g | 6.8 |
None of these foods is better or worse to eat than another; the table only shows how protein density changes the protein part of the score.
How does a scanned photo compare with typing the numbers in?
A scan is fast and works well for a plate you can see clearly, while typing numbers in — from a label or a recipe — tends to land closer to the package's own figures, especially for mixed dishes with sauces or dressing stirred through. If a photo comes back looking off for a layered dish like a stir-fry or a grain bowl, open the result and adjust the portion or swap in a close ingredient match before you save it — the meal score calculator also lets you type a meal in from scratch.
A photo estimate and a nutrition label for the same bowl can land a point or two apart on a 0 to 10 scale, and that's expected, not a sign the scan failed.
How does the score handle a mixed plate like a stir-fry?
A stir-fry with tofu, vegetables and a sauce mixes a minimally processed base with a smaller processed component, so the quality part often lands between the two extremes rather than at either end.
Tofu and vegetable stir-fry with about 24 g of protein, 9 g of fiber and 420 kcal comes out to roughly 5.7 g of protein and 2.1 g of fiber per 100 kcal, both close to the score's references, and the tofu and vegetable stir-fry recipe scores 8.3 out of 10.
Which tracking mode fits the way you want to see results?
PCOS Weight Loss offers two ways to use the same photo score: Weight Loss Mode, which shows calories, macros and a weight trend next to the score, and Gentle Mode, which has no calories and no scale anywhere in the app. Both modes sit alongside five rings — protein, fiber, movement, sleep and meals — so a day's pattern is visible even without a calorie count. If fiber is the part you want to watch most closely, the fiber tracker page walks through how that ring and that part of the score line up.
On the food scanner app privacy question specifically: meals, weight, cycle days and symptoms you log are stored on the phone, and the app is free to start with no account needed. A meal photo works differently — it's sent to the app's server and on to OpenAI to identify the food, and no copy is kept. The app also has no barcode scanner and no nutrition-label reader, so every entry is either a scanned photo or numbers typed in by hand.
What's a reasonable way to start using it?
Start with a meal you already know well — a bowl of oats, a salad, a plate of eggs — and scan it once, then check the four parts of the score rather than only the final number. Scanning a meal and getting a score this way, on something familiar, makes it easier to judge whether the estimate looks reasonable before trusting it on a dish you don't know as well.
If the fiber part looks low, a recipe like overnight oats with chia or chickpea and feta salad on this site shows what a higher-fiber version of a similar meal looks like, scored the same way, so you can see the arithmetic side by side with your own scan.
Frequently asked questions
What does a food scanner app that scores meals actually do?
It turns a photo of a plate into estimated grams of protein, fiber and added sugar plus a processing level, then blends those four parts into one 0-10 score. PCOS Weight Loss adds a food idea to try next alongside the number, so the score isn't the only output.
Is my data private when I use a food scanner app?
Meals, weight, cycle days and symptoms you log are stored on the phone, and there's no account needed. A meal photo is the exception: it's sent to the app's server and on to OpenAI to identify the food, and no copy is kept. Logging by hand sends nothing off the phone at all.
How accurate is a photo-based meal score?
The nutrition figures a photo produces are estimates, similar to a careful visual guess at a table. They can land a point or two from a label's own numbers on a 0-10 scale, which is expected — not a sign the scan went wrong. Typing numbers in from a label tends to land closer to the package figures.
What's the difference between Weight Loss Mode and Gentle Mode?
Weight Loss Mode shows calories, macros and a weight trend next to the meal score. Gentle Mode has no calories and no scale anywhere in the app. Both sit alongside the same five progress rings — protein, fiber, movement, sleep and meals — and the same scoring from a photo.
Does the app scan barcodes or read nutrition labels?
No. The app has no barcode scanner and no nutrition-label reader; it scores a meal from a photo of the plate or from numbers typed in by hand. The meal score calculator lets you enter a meal from scratch if that fits a dish better than a photo.
General nutrition information, not medical advice. Figures are estimates. Talk to a doctor or dietitian about your own needs.