 PCOS Weight Loss
How to Lower Added Sugar Intake
A practical guide to lowering added sugar intake by reading the Added Sugars label line, swapping specific foods, and understanding the meal score's flat 12 g added-sugar reference.
Published
Quick answer
To lower added sugar intake, check the Added Sugars line on labels, swap one high-sugar item for a lower-sugar version, and compare meals against the meal score's flat 12 g added-sugar reference, where lower added sugar scores higher.
Key takeaways
- Check the Added Sugars line on a label, not just Total Sugars, to see what was mixed in.
- Flavored yogurt and frosted cereal are common sources of added sugar compared with plain versions.
- The meal score's added-sugar part uses a flat 12 g reference — lower added sugar scores higher.
- One repeated swap, kept for about a week, usually changes more than rewriting every meal at once.
- Logging a meal by hand is free with no daily limit, useful for checking labels before you buy.
The fastest way to lower added sugar intake is to check the Added Sugars line on the label before you buy, then swap the highest-sugar item in your regular rotation for a lower-sugar version of the same food. A couple of repeated swaps usually change more than one big rule ever does.
This isn't about getting added sugar to zero. It's about noticing which everyday items carry the most of it, and knowing what one swap actually does to the added-sugar part of a meal's score.
Where do you actually find added sugar on a label?
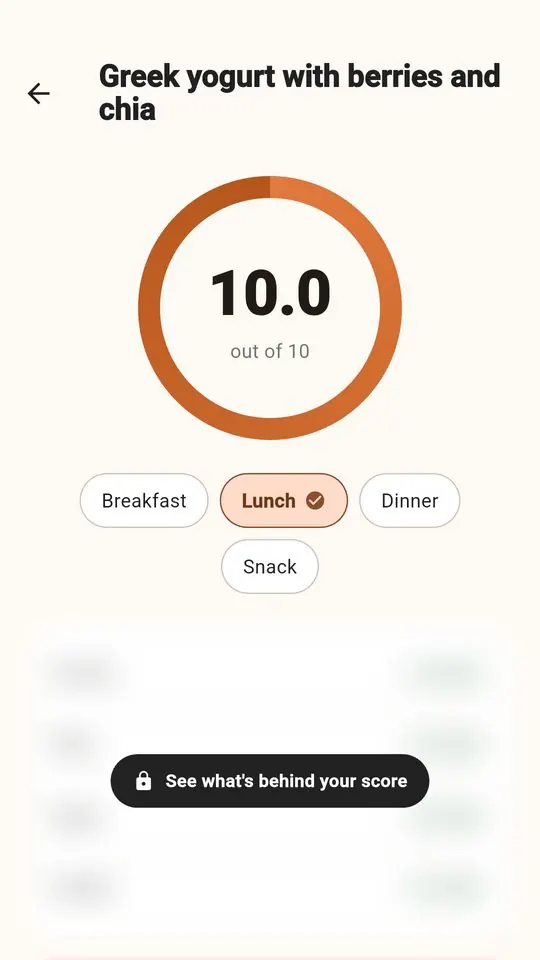
Nutrition labels list Total Sugars and, underneath it, a separate Added Sugars line — that second line is the one that matters here. Total Sugars includes sugar that's already in the food, like lactose in milk or fructose in fruit, while Added Sugars only counts what was mixed in during processing.
Checking that single line, rather than scanning the whole ingredient list, is usually the fastest way to compare two versions of the same food side by side. As a worked example: a flavored yogurt might list about 15 g of Added Sugars per cup, while a plain yogurt lists about 0 g, even though both show similar Total Sugars once you count the natural sugar already in milk. That gap is exactly what the added-sugar part of a meal's score reflects.
What are simple steps to lower added sugar intake?
A short, repeatable routine works better than trying to rewrite every meal at once.
- Pick one food you eat several times a week — yogurt, cereal, or a bar — and check its Added Sugars line on the label.
- Find a lower-sugar version of that same food, rather than switching to a completely different food.
- Keep that one swap in place for about a week before changing anything else.
- When you're ready, check the Added Sugars line on whatever you swap in next, using the same part of the label each time.
- Log the meal, by photo or by hand, and compare how the added-sugar part of its score looks next to the one it replaced.
Which everyday swaps lower added sugar the most?
Flavored yogurt, sweetened cereal, and bars with a sweet coating are usually the biggest sources of added sugar in an average day, because the sugar is mixed in during processing rather than coming from the food itself.
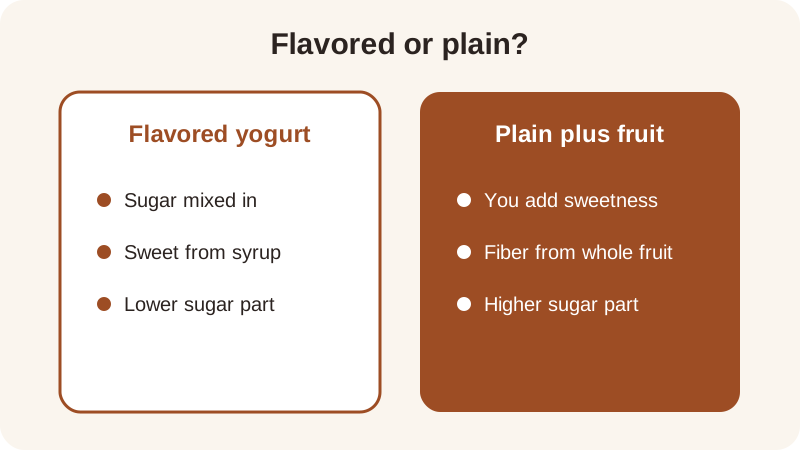
Swapping flavored yogurt for plain yogurt with fruit stirred in, for example, keeps the fruit's fiber and natural sugar but drops the added sugar that was mixed into the flavored version. The same logic applies to cereal: a plain or lightly sweetened option next to a frosted one usually shows a large gap on the Added Sugars line.
| Typical swap | Added sugar, about |
|---|---|
| Flavored yogurt, 1 cup | 15 g |
| Plain yogurt, 1 cup | 0 g |
| Frosted cereal, 1 cup | 12 g |
| Plain oats, 1 cup cooked | 0 g |
| Flavored protein bar | 12 g |
None of these foods is off the table — the table only shows which side of a swap carries more added sugar, so you can see the gap before deciding what to do with it. The flavored yogurt breakdown and the protein bar label guide go through specific examples.
Recipes built mostly from whole ingredients tend to carry little added sugar to begin with: Greek Yogurt Berry Bowl and Turkey Chili lean on plain yogurt, berries, beans and spices rather than a sweetened sauce, which keeps the added-sugar part of their score near the top without extra effort. Processing matters here too — the quality part of the score drops as a food moves from minimally processed toward ultra-processed, and ultra-processed foods are often where added sugar gets mixed in during manufacturing. The guide to ultra-processed food covers that overlap in more detail.
How does added sugar factor into the meal score?
In the PCOS Weight Loss meal score, added sugar is 20% of the total, alongside protein (30%), fiber (30%) and quality, or how processed the food is (20%). The added-sugar part uses a flat 12 g reference, and lower added sugar scores higher — it's a general reference this score uses, not a clinical target.
A snack with about 4 g of added sugar scores higher on that part than one with about 18 g, because it sits further under the 12 g reference. The four parts are combined unrounded, and only the final 0–10 score is rounded for display, so a small drop in added sugar can move the overall number even if protein and fiber stay the same. Try your own numbers in the meal score calculator, or read more on the how the score works page.
Do you need to cut out sugar completely?
No single meal or snack decides anything on its own. The app's quality part already accounts for a lot of what pushes added sugar up, so lowering added sugar intake and improving the quality part often move together without extra effort.
If counting anything feels like the wrong fit right now, Gentle Mode scores meals with no calories and no scale anywhere in the app, so you can still see the added-sugar part of a photo or hand-logged meal without tracking weight. Gentle Mode and the five rings — protein, fiber, movement, sleep and meals — sit alongside Weight Loss Mode if you'd rather see calories, macros and a weight trend next to the score.
Frequently asked questions
What's the difference between total sugars and added sugars on a label?
Total Sugars includes sugar already in the food, like lactose in milk or fructose in fruit. Added Sugars, listed just under it, only counts sugar mixed in during processing. Checking the Added Sugars line rather than Total Sugars is the more direct way to compare two versions of the same food.
Does flavored yogurt really carry more added sugar than plain yogurt?
Typically, yes — flavored yogurt carries noticeably more added sugar than plain yogurt, since the sweetness is mixed in during processing rather than coming from fruit you add yourself. Checking each container's Added Sugars line shows the exact gap, which varies by brand and flavor.
How is added sugar used in the meal score?
Added sugar is 20% of the PCOS Weight Loss meal score, alongside protein, fiber and quality. The added-sugar part uses a flat 12 g reference, and lower added sugar scores higher. It's a general reference this score uses, not a clinical target, and the four parts are combined unrounded before the final score is rounded.
Do I have to eliminate added sugar completely?
No. The score doesn't require zero added sugar — it simply scores lower added sugar higher on that one part. Small, repeated swaps, like choosing a lower-sugar version of a food you already eat often, tend to change a meal's score more than trying to remove sugar entirely in one step.
Where can I check added sugar without typing in numbers?
A meal photo in the PCOS Weight Loss app estimates added sugar along with the other three parts of the score; logging by hand works too and sends nothing off the phone. Both options show the added-sugar part on the same 0–10 scale.
General nutrition information, not medical advice. Figures are estimates. Talk to a doctor or dietitian about your own needs.