 PCOS Weight Loss
Protein Bars Added Sugar: What the Label Shows
A look at how much added sugar typical protein bars carry, how that number feeds the meal score's flat 12 g reference, and which whole-food snacks score higher instead.
Published
Quick answer
Protein bars added sugar amounts range from about 2 g to over 15 g per bar. That gram number feeds 20% of the meal score through a flat 12 g reference, often mattering more than the protein count on the front label.
Key takeaways
- Protein bars range from about 2 g to over 15 g of added sugar per bar.
- The score's added-sugar reference is a flat 12 g; lower added sugar scores higher.
- Added sugar is one of four score parts, alongside protein, fiber and quality.
- The 'Added Sugars' label line, not 'Total Sugars,' is what counts toward the score.
- Nut-and-seed style bars often carry less added sugar than chocolate-coated or dessert bars.
Protein bars added sugar amounts range from about 2 g to over 15 g per bar, and that gap changes a bar's meal score more than its protein number does. Checking the label for added sugar, not just total sugar, is the fastest way to tell bars apart.
A protein bar nutrition label lists two sugar lines: Total Sugars and Added Sugars. Only the Added Sugars line feeds the meal score's sugar part, so two bars with the same Total Sugars number can still score very differently if one gets its sugar from dates and the other from syrup. That difference is also why two bars that look almost identical on the front of the wrapper can land far apart once you run the numbers.
How much added sugar do protein bars typically have?
How much sugar is in a protein bar often depends more on its coating and binder than on its protein source. A nut-and-seed bar built mostly from almonds, oats and dried fruit often runs about 2 g to 4 g of added sugar per bar, while a chocolate-coated or dessert-style bar built around syrups and coatings can run about 12 g to over 16 g in a similar-sized bar.
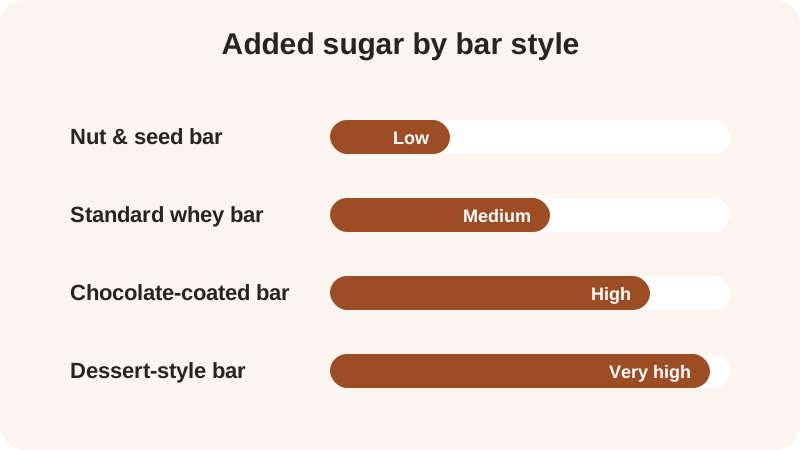
The table below uses ordinary, rounded figures for four common bar styles, so you can see how added sugar and protein density tend to move together.
| Bar style | Added sugar (about) | Protein per 100 kcal (about) |
|---|---|---|
| Nut & seed bar | 3 g | 9 g |
| Standard whey bar | 8 g | 10 g |
| Chocolate-coated bar | 12 g | 6.5 g |
| Dessert-style bar | 16 g | 4.5 g |
Protein and added sugar often move in opposite directions on a shelf like this: the lower-sugar bars in the table also carry more protein for their calories, while the higher-sugar ones carry less. That's a common pattern, not a rule for every bar — some do break it in either direction.
How does added sugar affect a protein bar's meal score?
The meal score weighs added sugar at 20% of the total, alongside protein at 30%, fiber at 30% and quality — how processed the food is — at 20%. Unlike protein and fiber, which the score measures per 100 kcal, added sugar is measured as a flat number: the reference is 12 g, and lower added sugar scores higher on that part, regardless of how big or small the bar is. These are the references this score uses, not clinical targets, and they're explained in full on the how the score works page.
Take the standard whey bar from the table: about 20 g protein, about 3 g fiber, about 8 g added sugar and about 200 kcal. That works out to about 10 g of protein per 100 kcal, above the score's 7 g protein reference, and 8 g of added sugar sits comfortably under the flat 12 g reference, so both the protein part and the sugar part land on the higher side.
The dessert-style bar comes in lower: about 10 g protein, about 1 g fiber, about 16 g added sugar and about 220 kcal. That's roughly 4.5 g of protein per 100 kcal, below the 7 g reference, and 16 g of added sugar sits above the flat 12 g reference, so both the protein part and the sugar part pull the score down before quality is even factored in.
The quality part works the same way across any food: it scores by calories at 1.0 for minimally processed, 0.6 for processed and 0.15 for ultra-processed. A bar built mainly from nuts, seeds and dried fruit often sits closer to the processed end, while a bar with protein isolates, sugar alcohols, emulsifiers and a chocolate coating more often counts as ultra-processed — which pulls down a fifth of the score regardless of how high the protein number looks on the front label. The ultra-processed food guide walks through how that part is worked out.
Which swaps score higher than a typical protein bar?
A few snack options on the site carry little to no added sugar and still land a strong protein number. Edamame with Sea Salt has about 17 g protein, about 8 g fiber and about 190 kcal, for a meal score of 10.0. Cottage Cheese & Cucumber Snack has about 20 g protein, about 2 g fiber and about 180 kcal, for a meal score of 8.5.
Neither of those is a protein bar, and that's partly the point: a snack built from whole foods skips the added-sugar line almost entirely, which is one reason the fiber and sugar parts of its score land higher without any added-sugar number to weigh against the 12 g reference at all. For something closer to a bar's texture and portability, Overnight Oats with Chia scores 7.6, with about 14 g protein and about 10 g fiber against about 380 kcal — a different shape of snack with its own tradeoffs. See the full recipes, each with its own 0–10 score, on the edamame and cottage cheese recipe pages.
How do you read a protein bar's nutrition label for added sugar?
Reading a protein bar label for added sugar takes four quick checks, in order.
- Find the Nutrition Facts panel and locate the "Total Sugars" line.
- Look directly beneath it for the indented "Added Sugars" line — that's the number the meal score uses, not Total Sugars.
- Compare that gram figure with the score's flat 12 g reference: lower lands higher on the sugar part.
- Scan the ingredient list for syrup, honey, cane sugar or fruit juice concentrate near the top, which often lines up with a higher Added Sugars number.
Scanning a label this way takes about the same time as reading the protein number alone, and it tells you more about where a bar lands across all four parts of the score, not just one of them. The food scanner in the app reads these numbers from a photo of the label or the bar itself, so there's no manual subtraction needed.
None of this makes one bar better or worse to eat — it just shows what's in it and how that shows up in the score, the same way the how the score works page explains for any food. Try a specific bar's own numbers in the meal score calculator to see its full score rather than just the sugar part on its own.
Frequently asked questions
How much added sugar is normal in a protein bar?
It varies a lot by style. A nut-and-seed bar often runs about 2 g to 4 g of added sugar per bar, while a chocolate-coated or dessert-style bar can run about 12 g to 16 g or more in a similar-sized bar. Checking the label beats guessing from the front of the wrapper.
Does added sugar matter more than protein for a protein bar's score?
Protein and added sugar are each weighted differently — protein is 30% of the meal score and added sugar is 20%. A bar can carry a strong protein number and still lose ground on the sugar part if its added sugar sits well above the score's flat 12 g reference.
What counts as added sugar on a protein bar label?
The 'Added Sugars' line sits indented beneath 'Total Sugars' on the Nutrition Facts panel. It covers sugars added during processing — syrups, honey, cane sugar — separately from sugars already present in milk or fruit. Only the Added Sugars number feeds the meal score's sugar part.
Are nut-and-seed protein bars lower in added sugar than chocolate ones?
Often, yes. A bar built mainly from nuts, seeds and dried fruit typically carries less added sugar than one with a chocolate coating or dessert-style flavoring, since the coating and binder are common places added sugar shows up.
Can a protein bar with more added sugar still score reasonably well?
It can, if its protein and fiber per 100 kcal are high enough and it isn't heavily ultra-processed, since the four parts of the score are combined rather than any one part deciding the whole number.
General nutrition information, not medical advice. Figures are estimates. Talk to a doctor or dietitian about your own needs.